On The Other Hand: Q3 2023 OPE Dealer Survey report
We use our quarterly dealer surveys to study a specific time period – Q3 2023 this time – and to identify trends over time. And while we complete our Q4 dealer survey data, we will share this Q3 survey report to give us all a comparison. Thank you to all who contribute to our information gathering. When comparing to our Q2 survey data, we see what could be contradictory information. More likely, it is just that dealers experienced different results depending on region, market, and other factors. Hence the title, “On the Other Hand.”
We source our data from a nationwide group of OPE dealers. Here’s a look at who they are:
- 24% claim annual revenue below $500,000.
- 54% bring in more than $4 million in annual revenue.
- 88% are “owners” of an independent power-equipment sales and service business.
- 82% have one location.
- 7% have 4 or more locations.
- (This data has remained mostly consistent across this year’s quarterly surveys.)
What products do these businesses carry? A wide mix, but more than two-thirds carry all of these products: battery-powered equipment, blowers, brushcutters, chain saws, edgers, engines, fuel additives, generators, hedge trimmers, mowers (riding, stand on, zero turn, walk behind), pressure washers, string trimmers, tillers.
A small number (less than 10 percent) carry these items: apparel, ATVs, boats, trailers, excavators, go-karts, grills, motorcycles, robotic mowers, rakes, scrapers, skid-steers, snowmobiles, top dressers, trenchers, golf carts.
Let’s get into Q3 business conditions and analysis. You can read our OPE Trends report here.
Satisfied? A Declining Middle
We ask: Rate your satisfaction with being an OPE dealer at the current time, on a scale of 1 to 10, with 1 being “not at all satisfied” and 10 being “extremely satisfied.”
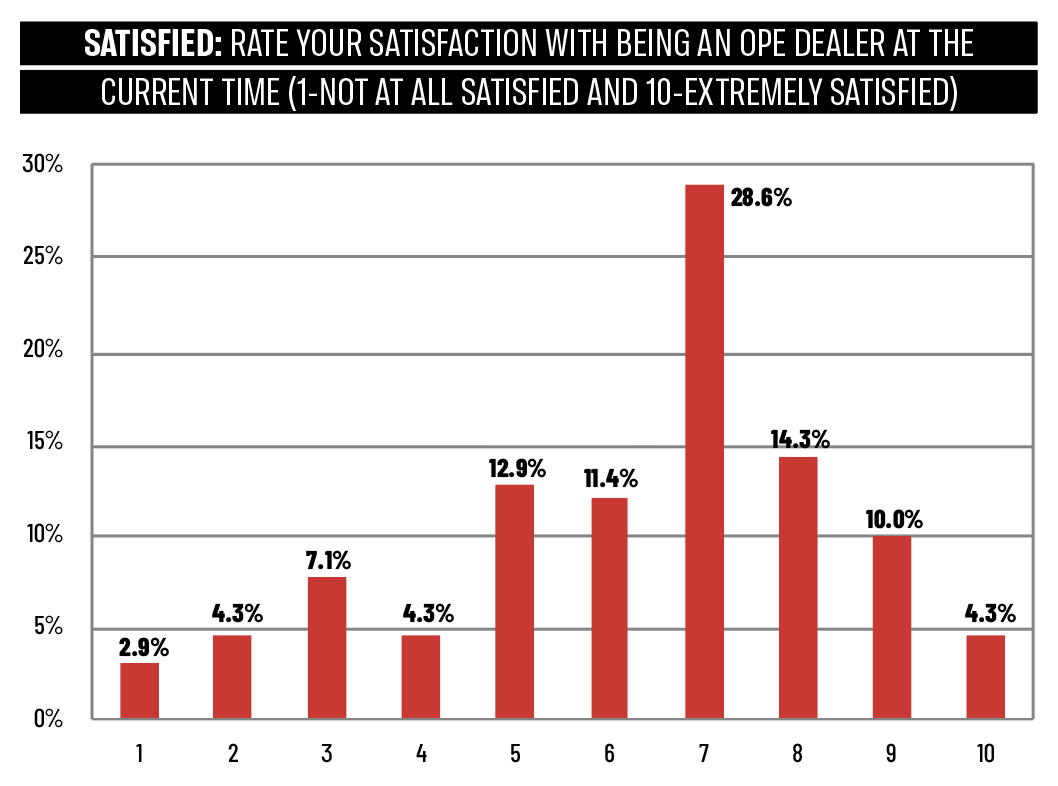
In Q2 survey reporting, we saw a shift to the middle on the “satisfaction” question. At that time, in the height of the selling season, nearly three-quarters (73%) of dealers scored this from 5 through 8. Many dealers were dealing with a drought. Today, we see in the Q3 reporting an increase in satisfaction over Q2. More dealers, 57% of them, scored this between 7 and 10, leaning toward extremely satisfied. In Q2, just 50% of dealers scored from 7 to 10.
On the other hand, nearly 20% of dealers in Q3 reporting said they were less satisfied, scoring this between 1 and 4 on the satisfaction scale. The middle is fading. Some dealers are certainly feeling the impacts of that summer drought, which added to already growing inventory issues.
Conditions by Department? Service Strength
We ask: Please rate the following, from Very Strong to Very Weak. FYI, a low score on the chart is good here!
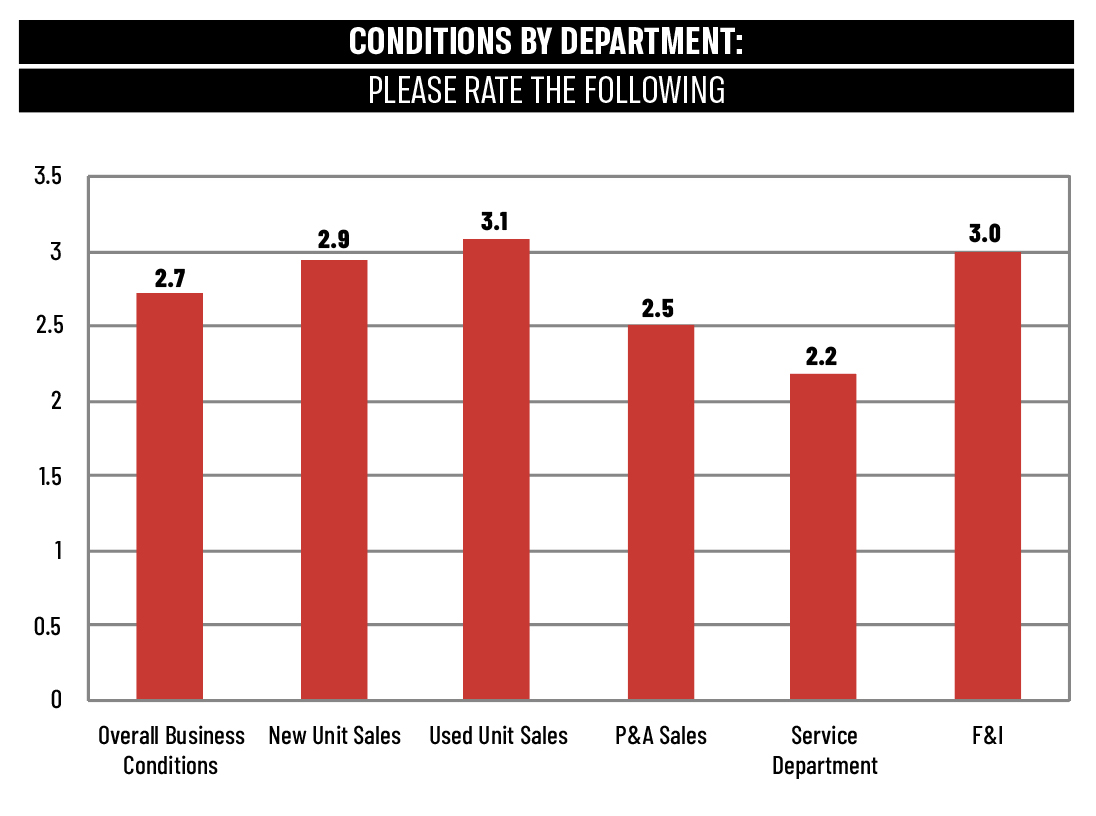
We ask about the state of five separate business segments, plus “Overall Business Conditions” and, compared to Q2 survey results, overall business conditions are better – or much worse. As with the previous question about “satisfaction,” the middle is declining when it comes to “business conditions.” More than 7% scored overall business as Very Strong; that’s a big increase from the 2% who said the same in Q2. More dealers scored both New and Used Unit Sales as Very Strong in Q3 compared to Q2. On the other hand, more than 18% scored overall business conditions as Poor or Very Weak, a noted increase from the 13% scoring the same in Q2.
The Service Department remains the strong point for dealers. More than two-thirds of dealers scored Service as Good or Very Strong in Q3; that’s up slightly from Q2. Zero dealers in Q3 said that “F&I” was Very Strong.
What Provided Growth? ZTR
We asked: What line of business provided you with the largest growth in Q3?
While battery-powered products continue to provide growth for OPE dealers we surveyed, zero-turn mowers drove the gains in Q3. Some dealers called out stand-on mowers specifically. Handheld equipment, specifically trimmers and chain saws, also brought growth for dealers. The “No Growth” response was popular for this period, as it was in our Q2 survey. A few dealers mentioned the drought again, while a couple dealers cited increasing competition – “cannot compete with big-box stores and internet prices.”
Business outlook? Up and Down
We asked: Based on how you feel today and the end of Q3, where do you expect year-end 2023 company revenues will end up compared to 2022?
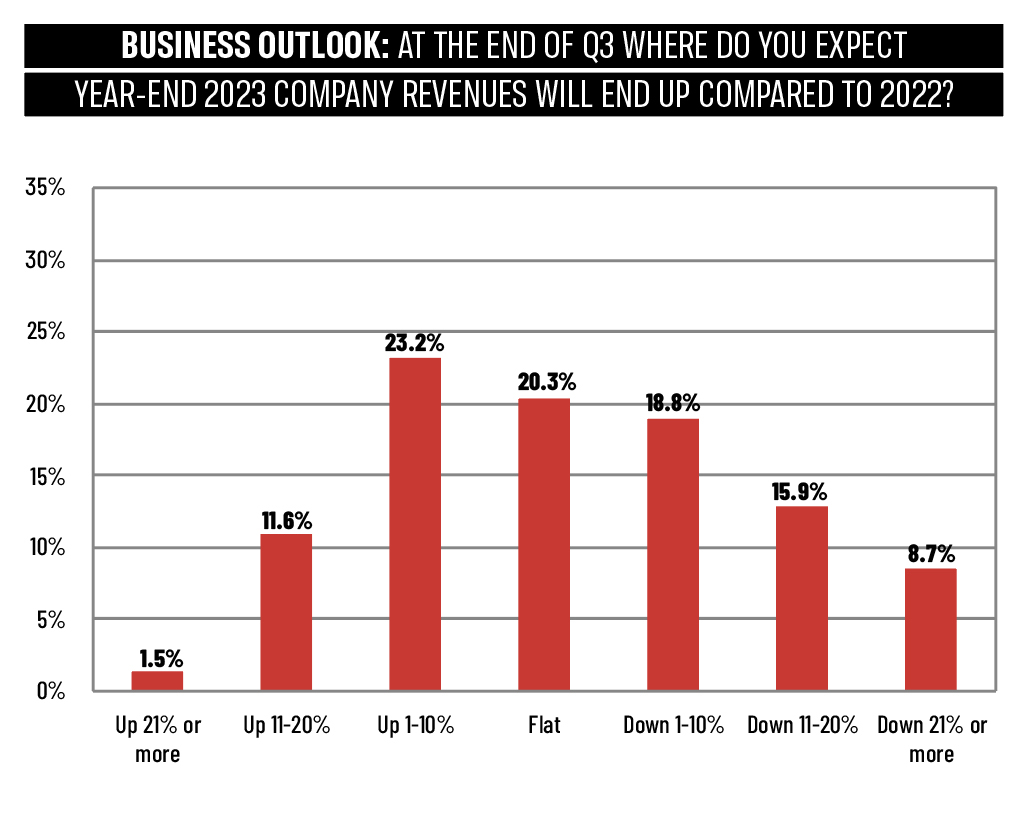
The outlook is improving and worsening at the same time. Fewer dealers in our Q3 survey said they expect a Flat year-end result; the number is down to 20%, compared to 29% of dealers in Q2 that expected a Flat year.
Less middle means more at the top and the bottom. In Q3, 36% of dealers said they expected 2023 to be up, while only 29% in Q2 predicted growth. On other hand, more than 43% of Q3 respondents said they expected 2023 to show a downturn. In Q2, that group was slightly smaller.
External Risk Factors
We asked: Which of the following external risk factors are you more concerned about?
In this Q3 survey, we learn that dealers are increasingly concerned about economic and political issues outside the U.S – 51% of dealers said so, compared to just 35% in the Q2 survey. Note: we compiled this survey data prior to the conflict in Israel and the Gaza strip.
Employment is a growing concern for dealers, as are the U.S. housing market, and the U.S. political environment. Still, price inflation remains a concern for more than 75% of dealers surveyed, despite lower inflation.
And while 0% of dealers in Q2 cited the Coronavirus as a concern, it eased back into dealers minds, with nearly 5% of dealers in Q3 claiming concern as the virus makes its way back into our lives at the start of the cold and flu season.